Your customers hold the key to your business’s future. A single negative interaction can unravel months of hard work while a loyal customer can be your most valuable asset. That’s why understanding and improving your Net Promoter Score is crucial.
Imagine a world where your customers are not just satisfied but enthusiastic promoters of your brand. This is the power of NPS. By measuring customer loyalty on a simple 0-10 scale, NPS offers invaluable insights into what your customers truly think.
But what does a "good" NPS score actually look like? And how can you benchmark your performance against industry leaders?
Let's dive deep into the world of NPS and uncover what constitutes a good NPS score and how you can leverage industry benchmarks to set realistic goals and drive improvement. Let's get started!
TL;DR
- NPS is a simple, effective metric to gauge customer loyalty and predict future growth by identifying promoters, passives, and detractors, enabling targeted actions to improve customer experience.
- A good NPS ranges from 0 to 30, while scores above 70 are considered world-class.
- Factors that affect NPS benchmarking include market competition, industry expertise, and customer tolerance levels, among others.
- NPS is calculated using the absolute method by subtracting the percentage of detractors from promoters or the relative method by comparing against industry benchmarks.
- You can analyze NPS by comparing it with industry averages, regional scores, survey channels, using baseline NPS as benchmarks, and correlating with other business metrics.
- Zonka Feedback is an NPS survey tool that offers advanced segmentation, AI-driven sentiment analysis, NPS automation, advanced reporting, and effective closing of the feedback loop to support enterprises in improving their NPS. Sign up for a free trial or schedule a demo to explore its NPS features and drive business growth!
Measure Customer Loyalty with NPS ❤️
Create NPS surveys, measure customer loyalty, and close the feedback loop with Zonka Feedback.

Why Does NPS Matter?
In 2003, when Fred Reichheld introduced the Net Promoter Score (NPS) concept, it was intended to create a simple, easy-to-understand metric that could be universally applied across industries. Over time, NPS has become a key reference point for businesses aiming to enhance their customer experience.
💡Did you know that the original name for NPS was actually "Customer Loyalty Index"? It was later shortened to the catchy and memorable Net Promoter Score.
Since its inception, NPS has become the golden standard for measuring customer loyalty. Why, you ask? Because in a world obsessed with instant gratification, keeping customers happy is like finding a four-leaf clover. Here are some more reasons why:
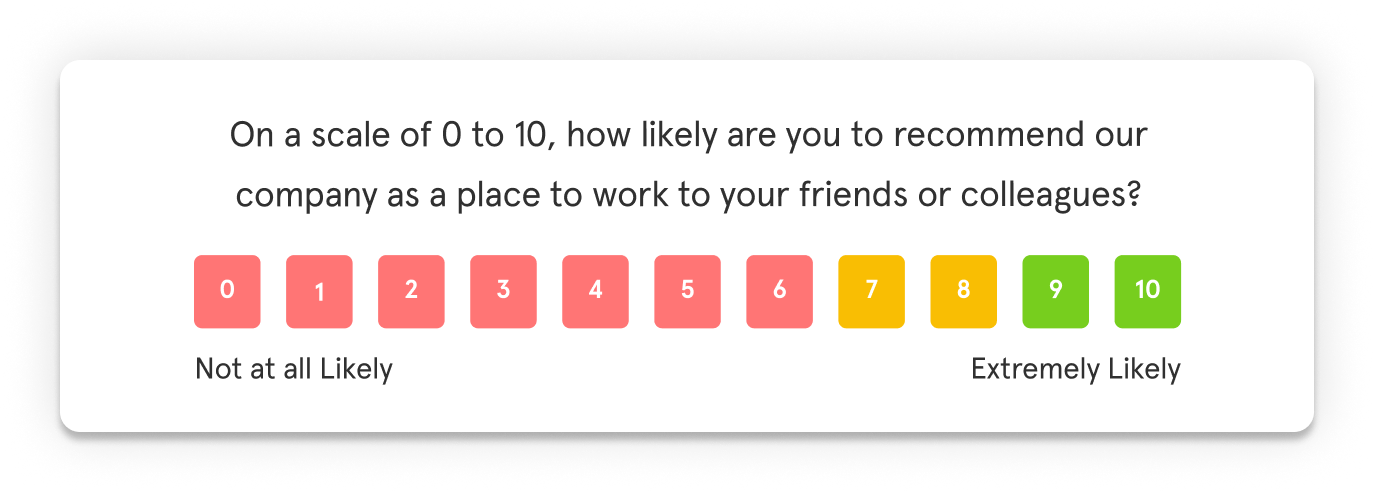
- Simplicity and Clarity: NPS is calculated based on a single question: "On a scale of 0-10, how likely are you to recommend our product/service to a friend or colleague?" This simplicity allows you to quickly gauge customer sentiment.
- Word-of-Mouth Magic: Happy customers are your secret marketing agents. They whisper sweet nothings about your brand to their friends and family, creating a ripple effect of goodwill.
- Customer Retention: Loyal customers are like old friends – they stick around even when times get tough. A high NPS indicates a strong customer base, saving you the heartache and cost of constant customer acquisition.
- Predictive Power: High NPS scores are often correlated with customer loyalty and future growth. Companies with high NPS scores tend to have more repeat customers, higher customer lifetime value, and stronger word-of-mouth referrals.
- Actionable Insights: NPS helps you identify detractors, passives, and promoters. This segmentation allows you to target specific actions to improve customer experience and loyalty.
- Benchmarking: NPS scores can be used to benchmark performance against competitors and industry standards. This benchmarking can highlight areas for improvement and competitive advantages.
What is a Good NPS Score?
Let's talk numbers. NPS, while simple to calculate, can be tricky to interpret. Determining what constitutes a "good" NPS score can vary depending on the context and industry. However, some general benchmarks can help guide your business:
- Negative Scores: Any score below 0 indicates that a company has more detractors than promoters, signaling significant issues with customer satisfaction.
- Positive Scores: Scores between 0 and 30 are considered good. These indicate a stable customer base with a decent number of promoters.
- Excellent Scores: Scores between 30 and 70 are excellent, showing that a significant majority of customers are promoters.
- World-Class Scores: Scores above 70 are world-class, reflecting a company with exceptional customer loyalty and satisfaction.
Good NPS Score by Industry
Just like athletes have different performance metrics, industries have varying NPS benchmarks. A stellar score in telecom might be average in retail. So, where does your business stand? Let's find out by looking at NPS industry averages.
| Industry | Average NPS | Source |
|---|---|---|
| Technology & Software | 50-70 | QuestionPro |
| Retail and E-commerce | 40-60 | Growfrog.io |
| Finance and Banking | 30-50 | Fullview.io, The CX Lead |
| Healthcare | 30-60 | Doran, Fullview.io |
| Hospitality and Travel | 50-70 | Fullview.io |
| Telecommunications | 20-40 | The CX Lead |
| Consumer Goods | 30-50 | Fullview.io |
| E-commerce | 35-55 | Doran |
| Logistics and Shipping | 25-45 | Growfrog.io, Fullview.io |
| Real Estate | 20-35 | The CX Lead |
| Education | 30-50 | Doran |
| Travel and Tourism | 40-60 | Fullview.io |
| Manufacturing | 25-45 | The CX Lead |
| Food and Beverage | 30-50 | Fullview.io |
| Insurance | 30-40 | The CX Lead |
NPS Scores from Famous Companies
Now that you know what the industry average is, you should also acquaint yourself with what the big players are up to. From tech giants to retail titans, let us look at some famous companies and their Net Promoter Score so that you can benchmark your own performance and identify areas for improvement.
| Company | Industry | NPS Score | Source |
|---|---|---|---|
| Apple | Technology and Software | Around 70 | Fullview.io |
| Netflix | Media and Entertainment | High 60s | The CX Lead |
| Amazon | Retail and E-commerce | Approximately 60 | The CX Lead |
| Tesla | Automotive | Around 97 | Fullview.io, The CX Lead |
| Starbucks | Food and Beverage | Around 77 | The CX Lead |
| Princeton Mortgage | Financial Services | 98 | The CX Lead, Fullview.io |
| Metro Bank | Banking | 82 | The CX Lead |
| T-Mobile | Telecommunications | 82 | The CX Lead |
| Warby Parker | Retail | 80 | Growfrog.io |
| Technology and Software | 50-70 | Fullview.io | |
| Kaiser Permanente | Healthcare | 65 | The CX Lead, |
| Hilton | Hospitality and Travel | 74 | Growfrog.io |
| Verizon | Telecommunications | 35 | The CX Lead |
| Procter & Gamble | Consumer Goods | 50 | The CX Lead |
| Shopify | E-commerce | 55 | Doran, QuestionPro |
| FedEx | Logistics and Shipping | 40 | Growfrog.io, Fullview.io |
| Zillow | Real Estate | 35 | Doran, The CX Lead |
| Coursera | Education | 50 | Doran, QuestionPro |
| Booking.com | Travel and Tourism | 65 | Fullview.io, Growfrog.io |
| Caterpillar | Manufacturing | 45 | Doran, The CX Lead |
| Unilever | Consumer Goods | 50 | Growfrog.io, Fullview.io |
| Allianz | Insurance | 40 | The CX Lead, Doran |
Benchmarking your NPS
Benchmarking your Net Promoter Score is crucial for understanding your market position, identifying improvement areas, and setting realistic goals. By comparing your NPS to industry standards, you can gauge your performance, pinpoint weaknesses, and learn from top performers.
The data-driven approach for NPS benchmarking helps you refine your customer experience, boost satisfaction, and gain a competitive edge. When you do this continuously and over time, you can track progress, facilitate a customer-centric culture, and drive overall business growth.
Factors Affecting NPS Benchmarks
Your NPS is a powerful indicator of customer loyalty, but it's not immune to external forces. By understanding these factors, you can set realistic goals and devise effective strategies. Let us look at some factors that you must take into account:
- Niche vs. Crowded Market: In a crowded market, customers have more options, increasing their tolerance for subpar experiences. For instance, in the highly competitive smartphone industry, customers expect cutting-edge technology and impeccable service. On the other hand, niche markets often enjoy higher NPS scores due to less intense competition and a more loyal customer base.
- Industry Expertise: Companies with a deep understanding of their industry often set the NPS benchmark. For instance, tech giants like Apple or Tesla have cultivated a loyal following by consistently delivering innovative products and exceptional customer experiences.
- Customer Tolerance Levels: How much can your customers endure before defecting? Industries like healthcare or banking deal with sensitive information, so customer tolerance is low. A single misstep can severely impact NPS. Conversely, in fast-paced industries like fashion, customer expectations may be more forgiving.
- Vendor Switching Barriers: High switching costs (financial, time, or data loss) can artificially inflate NPS. However, this is a double-edged sword. If customers are trapped, they may express dissatisfaction through lower ratings.
- Global Events: Economic downturns, geopolitical tensions, or natural disasters can significantly impact NPS. For example, during a recession, customers may prioritize cost over service, leading to lower scores.
- Demand-Supply Dynamics: Demand and Supply are the two elemental factors that play a crucial role in NPS. In high-demand markets with limited supply, companies may prioritize revenue over customer satisfaction. This can lead to lower NPS revenue and scores. Conversely, in saturated markets, intense competition forces companies to focus on customer retention, driving higher NPS.
Methods of Calculating Net Promoter Score
There are two primary methods for calculating NPS: the absolute method and the relative method. Each method has its unique approach and application. Let's look at each method.
a. Absolute Method
The absolute method is the traditional and most widely used approach to calculate NPS. Here’s how it works:
- Ask the Magic Question: "On a scale of 0 to 10, how likely are you to recommend our product/service to a friend or colleague?"
- Categorize your Customers: Divide respondents into three groups:
- Promoters (9-10): These are your raving fans who love your brand.
- Passives (7-8): They're satisfied but not overly enthusiastic.
- Detractors (0-6): Uh-oh. These folks are unhappy and could damage your reputation.
- Calculate your Score: Subtract the percentage of Detractors from Promoters. This score can range from -100 (all detractors) to +100 (all promoters). For example, if 60% are Promoters and 20% are Detractors, your NPS is a healthy 40.
b. Relative Method
The relative method, also known as benchmarking, compares your company’s NPS against the scores of competitors or industry averages. Think of this as NPS with a competitive edge. This method provides context to the NPS, helping you understand your performance relative to peers. The steps include:
- Calculate Your NPS: Use the absolute method to determine your score.
- Obtain Competitor NPS Scores: Gather NPS data from competitors or industry reports.
- Compare and Analyze: Assess how your NPS stacks up against others in your industry. This comparison can highlight areas of strength and opportunities for improvement. A higher score means you're outperforming the competition or improving over time.
Which NPS Method Should You Use?
Choosing between the absolute and relative methods depends on your business goals and context.
Use the absolute method when:
- Tracking Internal Progress: If your goal is to monitor your own performance over time, the absolute method is ideal. It allows you to see how changes in strategy or operations impact customer loyalty.
- Setting Baseline Metrics: For new businesses or those just starting with NPS, the absolute method provides a clear, straightforward measure to establish baseline metrics.
Use the relative method when:
- Benchmarking Performance: If you want to understand your position in the market, the relative method is crucial. It helps you see how you fare against competitors and industry standards.
- Strategic Planning: For businesses looking to develop competitive strategies, the relative method offers insights into market positioning and areas where you can differentiate yourself.
How to Analyze your NPS Results?
Your Net Promoter Score is a powerful tool, but it's the insights you glean from it that truly drive business growth. Let's explore how to transform your NPS data into actionable strategies.
1. Compare It with Your Industry Average
One of the first steps in analyzing your NPS results is to compare them with the industry average. This provides context and helps you understand where you stand relative to your competitors. Also, you should regularly review industry reports and studies to stay updated on average NPS scores and then use this data to identify trends and set competitive benchmarks.
For example, if your NPS is 40 and the industry average is 30, you are performing above average, indicating strong customer satisfaction. Conversely, if your score is below the industry average, it highlights areas needing improvement.
2. Compare the Score Within a Region
NPS can vary significantly by region due to cultural differences and market conditions. Analyzing your NPS by region helps tailor strategies to specific markets.
For instance, a retail chain may find that its NPS is higher in urban areas compared to rural ones. This insight can guide targeted marketing and customer service improvements in lower-scoring regions.
💡Pro tip: You must conduct regional workshops to gather qualitative feedback from local customers. Use this information to address region-specific concerns and improve NPS in those areas.
3. Consider the Survey Channel
The channel through which you collect NPS feedback can influence the responses. Email, SMS, in-app surveys, and face-to-face interactions can yield different results. You should analyze the response rates and scores across different channels. Identify which channels yield the most reliable data and consider adjusting your survey strategies accordingly.
For example, an airline might discover that NPS scores collected via in-flight surveys are higher than those collected through follow-up emails. This could be due to the immediacy of the experience.
4. Use Your Baseline NPS as Your Own Benchmark
Using your historical NPS data as a baseline helps measure progress over time. This internal benchmarking is essential for tracking the effectiveness of your initiatives.
For instance, a SaaS company that starts with an NPS of 20 can set incremental improvement goals, aiming to increase its score by 5 points every quarter.
💡Pro tip: You can segment your baseline data by customer cohorts, such as new vs. returning customers. This allows you to tailor improvement strategies to different customer segments.
5. Employee Net Promoter Score (eNPS)
In addition to customer NPS, evaluating employee satisfaction through the Employee Net Promoter Score (eNPS) is also important. eNPS measures how likely employees are to recommend their workplace to others, which directly impacts customer service and overall business performance.
- High eNPS scores indicate a motivated and loyal workforce, which typically leads to improved customer service and higher overall productivity. Regularly measuring eNPS helps you identify areas for improvement within your work environment, promoting a positive culture that can reduce turnover rates and enhance company reputation.
- Similar to customer NPS, employees are asked the NPS question and based on responses, they are categorized into Promoters (9-10), Passives (7-8), and Detractors (0-6). You can then calculate eNPS by subtracting the percentage of detractors from the percentage of promoters.
- For instance, a company with an eNPS of 50 has a highly engaged and satisfied workforce. This positive work environment likely translates into better customer interactions and higher customer satisfaction.
- You should regularly measure eNPS alongside customer NPS to identify correlations between employee satisfaction and customer satisfaction. Implement initiatives to improve workplace conditions based on eNPS feedback, fostering a positive culture that benefits both employees and customers.

Additional Tips for Analyzing NPS Results
Here are some tips that can further help you analyze your NPS data and make the most of it:
a. Segment Your Data
Segment your NPS data by customer demographics, product lines, or service usage to gain deeper insights. You can use advanced analytics tools to perform sentiment analysis on open-ended responses. This helps uncover underlying themes and customer sentiments that numerical scores alone might not reveal.
For example, a fitness equipment company segments its NPS data by product type (e.g. treadmills, stationary bikes, weights) and discovers that customers using treadmills are the most satisfied, while stationary bike users are less satisfied. Sentiment analysis reveals that stationary bike users frequently mention discomfort during use. This insight leads the company to redesign the stationary bikes, resulting in improved customer satisfaction and a higher NPS for that segment.
b. Look for Trends Over Time
Tracking NPS trends over time helps identify patterns and the impact of specific initiatives. You can create visual dashboards that display NPS trends and key performance indicators and share these dashboards with relevant teams to foster a data-driven culture.
For instance, a software company tracks its NPS monthly and notices a significant drop during the summer months. Further investigation reveals that many customers are dissatisfied with the support response time during this period. By hiring additional support staff for the summer, the company stabilizes its NPS and improves overall customer satisfaction.
c. Correlate NPS with Business Metrics
Link your NPS data with other business metrics such as revenue, customer retention, and lifetime value to understand the broader impact. You can use regression analysis to identify the relationship between NPS and specific business outcomes. This can help quantify the financial impact of customer satisfaction improvements.
d. Act on Feedback
Analyzing NPS is only valuable if it leads to actionable insights. You should develop a systematic approach to address the feedback received. If detractors consistently mention slow customer service, an action plan could include additional training for support staff and implementing a faster ticket resolution system.
You should create a "Voice of the Customer" committee that regularly reviews NPS feedback and prioritizes initiatives based on customer insights.
How to Improve NPS with Zonka Feedback?
Zonka Feedback offers a comprehensive platform that enhances your ability to measure, analyze, and act on Net Promoter Score (NPS) data effectively. Here’s how Zonka Feedback can help improve your NPS:
1. Customer Segmentation
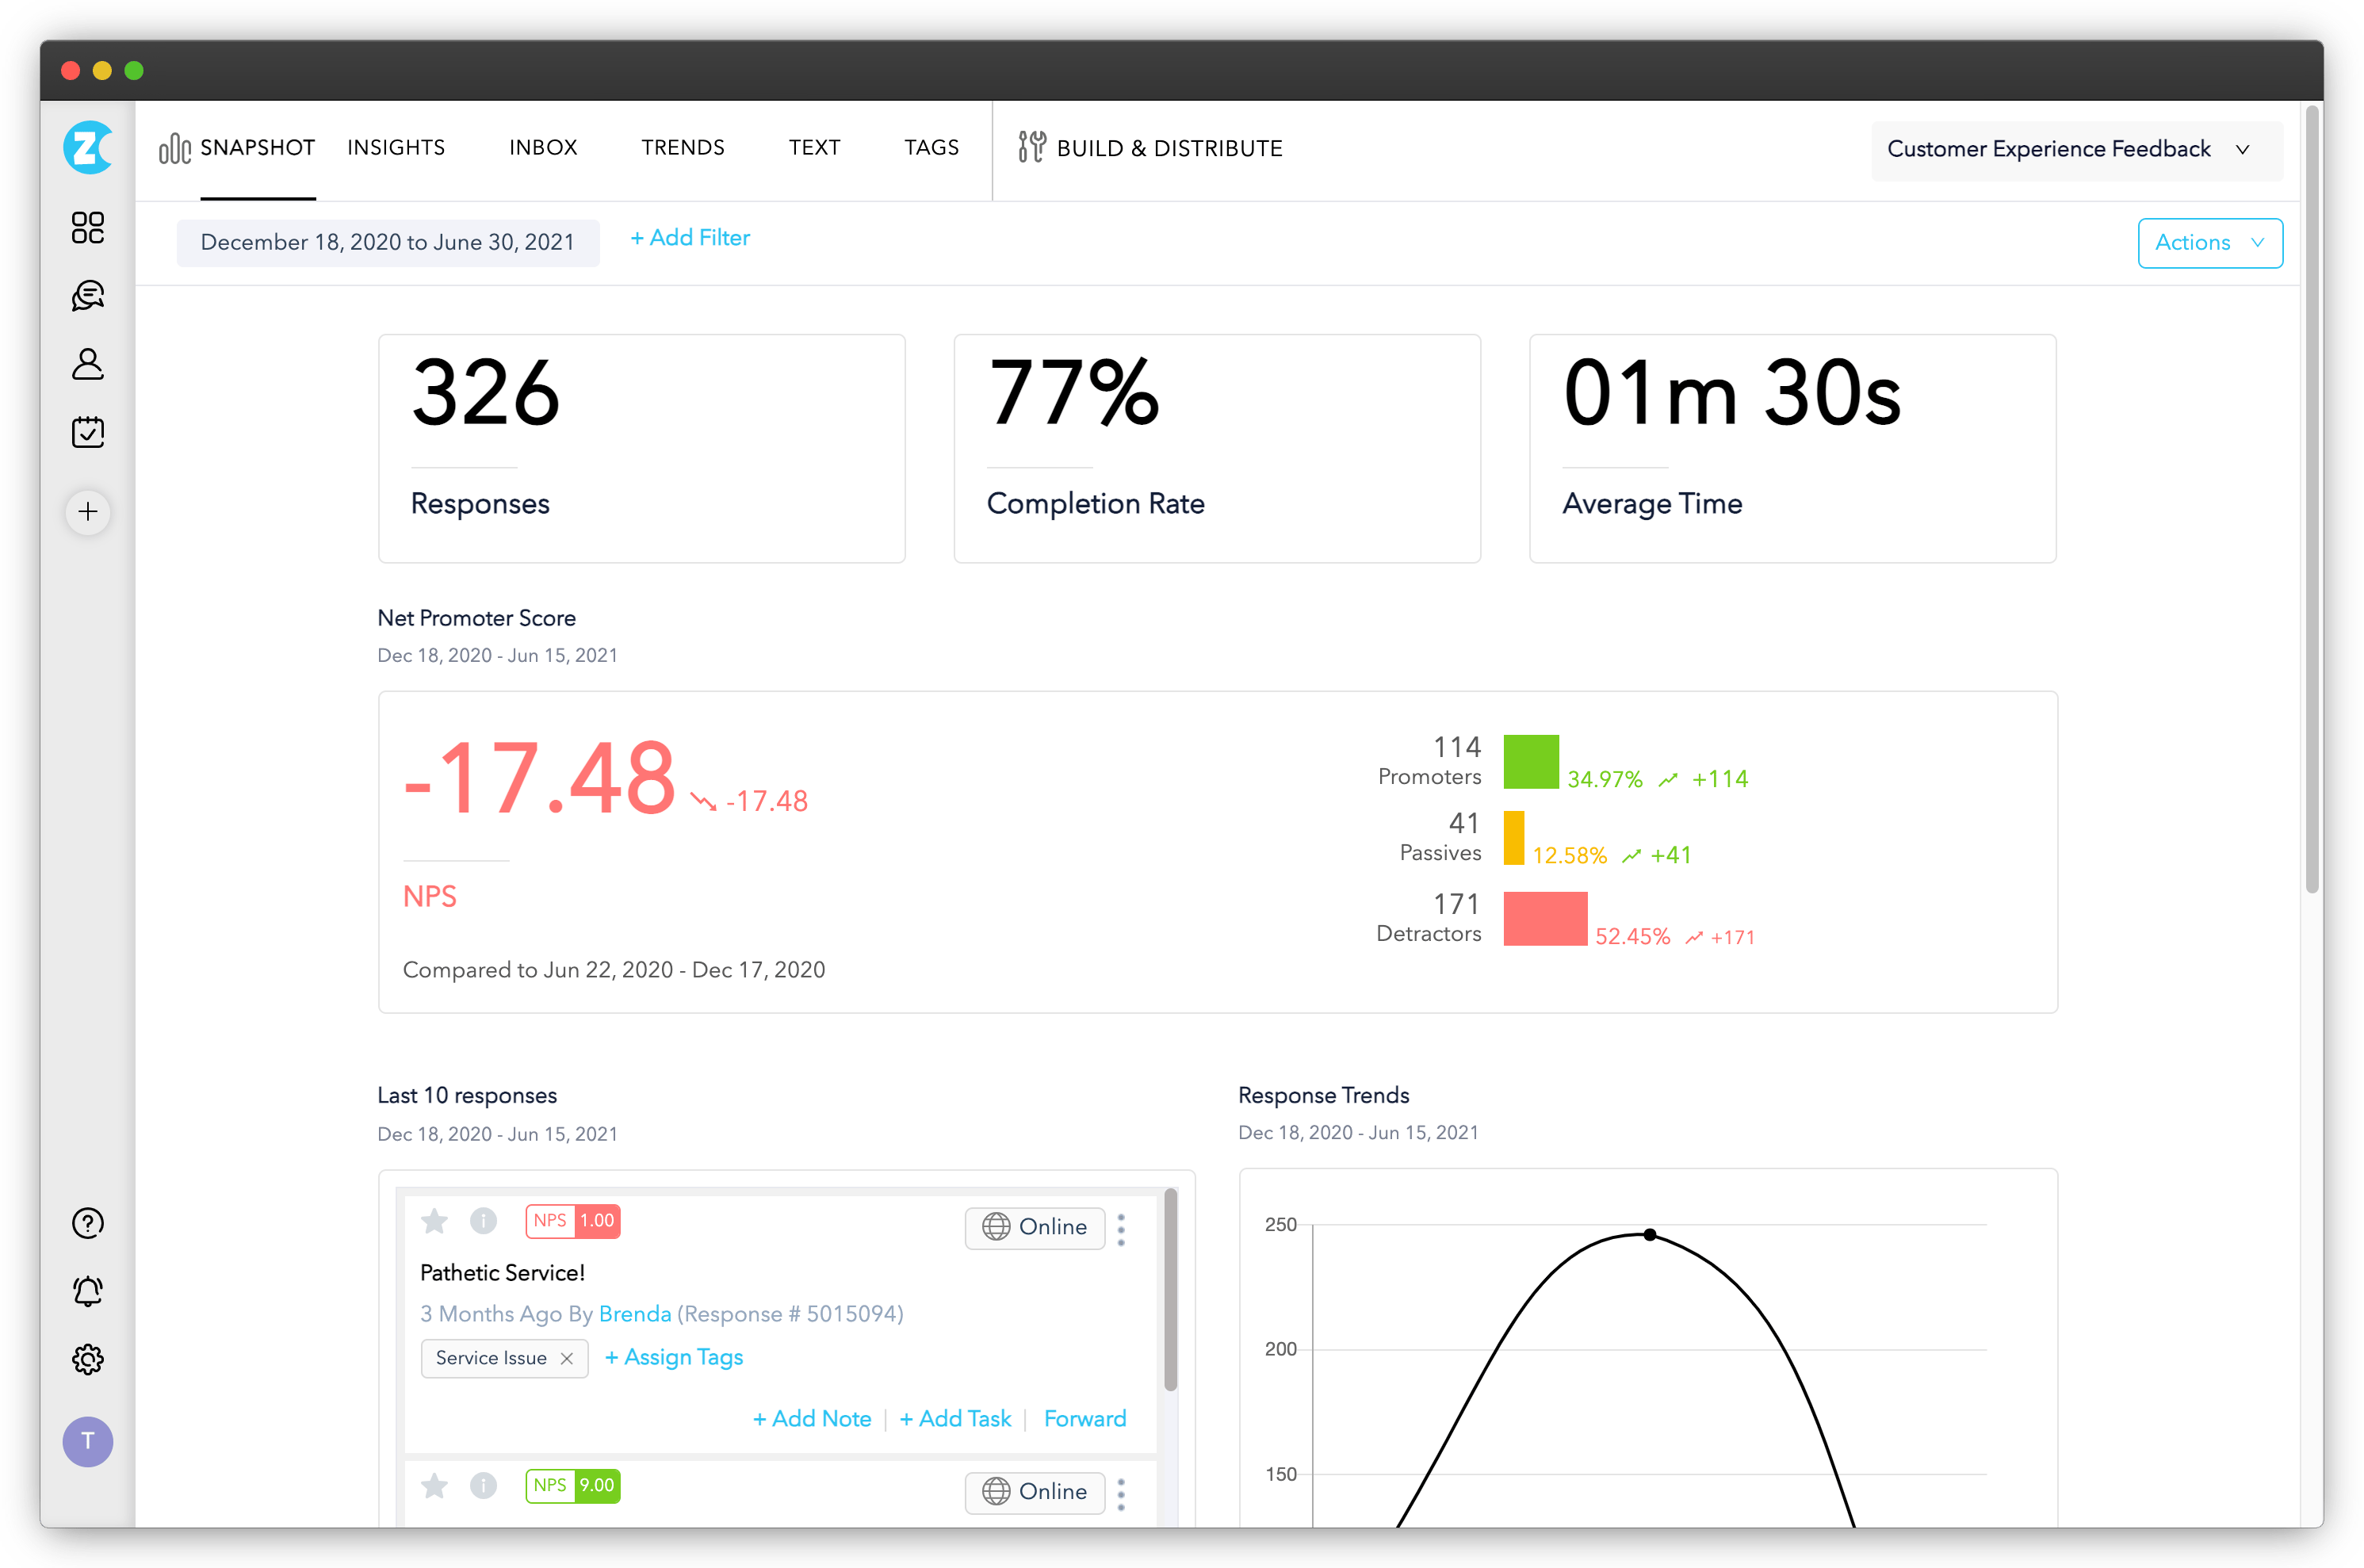
Zonka Feedback’s dashboard automatically calculates your NPS score from customer feedback. However, to gain actionable insights, it’s crucial to segment customers beyond just promoters, passives, and detractors. This NPS tool allows you to create custom segments based on metrics important to your business.
For example, if you offer multiple pricing plans, you can segment your NPS data by these plans. This might reveal that customers on a premium plan have a higher NPS compared to those on a basic plan, allowing you to tailor strategies to improve satisfaction among lower-scoring segments.
Non-Customers, Prospects, Freemium, and Paying Customers
Zonka Feedback enables you to segment customers based on their interaction level with the company, such as non-customers, prospects, freemium users, and paying customers.
For example, a SaaS company can segment survey respondents into:
- Non-customer: Individuals who have shown interest but haven’t made a purchase.
- Prospective customer: Users who have signed up for a free trial.
- Freemium customer: Users utilizing the free version of the product.
- Paying customer: Subscribers to paid plans.
By segmenting this way, the company can create targeted follow-up strategies such as converting freemium users to paid plans or nurturing prospects into becoming customers.
2. AI-Driven Insights and Sentiment Analysis
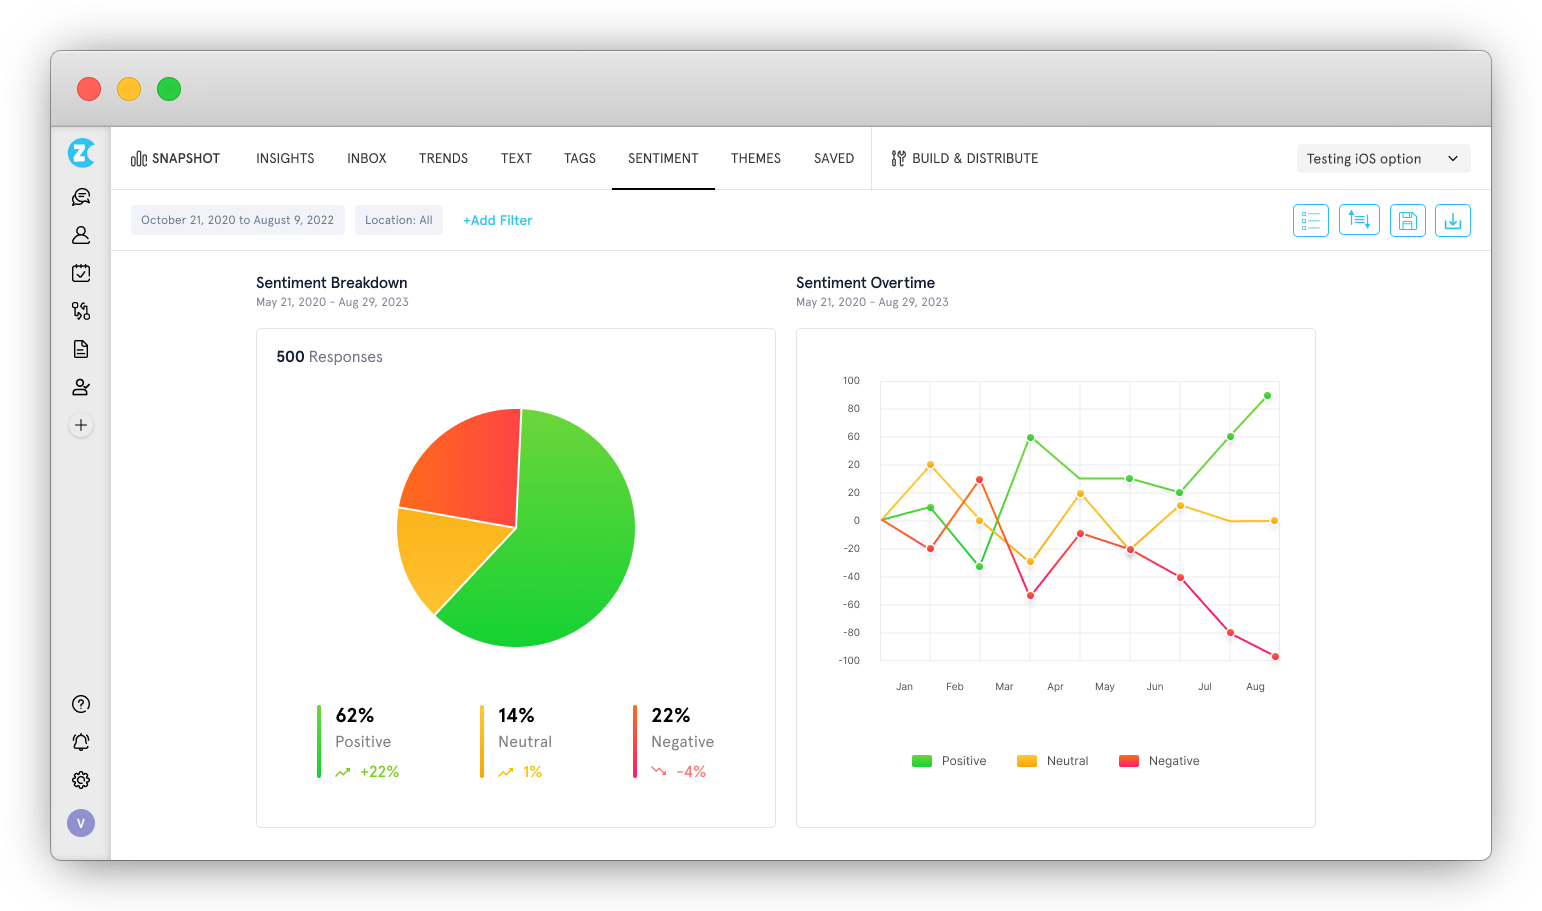
This tool leverages advanced AI technology to analyze sentiments, emotions, urgency, and intent behind customer feedback. This level of analysis provides you with deep insights into the underlying emotions and motivations driving customer responses. By understanding these factors, you can tailor your actions more precisely and effectively.
For instance, your retail company notices a surge in negative feedback sentiment related to your customer service during holiday seasons. By using AI-driven insights, you identify that the primary emotion expressed is frustration due to long wait times. You can then implement additional staffing and faster response mechanisms during peak periods, directly addressing the root cause of dissatisfaction and improving NPS.
3. Automated Workflow Designer
Zonka Feedback’s automated workflow designer simplifies the process of handling feedback by setting up automated responses based on NPS scores. This feature can trigger a variety of actions, such as sending notifications to relevant team members, tagging responses for easy reference, assigning tasks, and scheduling follow-ups with customers.
For instance, your e-commerce platform receives a low NPS score from a customer due to a delayed delivery. The workflow designer automatically tags the feedback as urgent, assigns a task to the customer service team to investigate and resolve the issue, and sends a notification to the logistics team to prevent future delays. This ensures timely and effective responses, turning a negative experience into a positive one.
4. Real-Time Alerts and Follow-Up
This NPS software also offers real-time alerts and follow-up features to ensure timely responses to customer feedback. You can set up real-time alerts for low NPS scores.
This will allow your team to follow up with detractors immediately, addressing their concerns before they escalate. Your timely intervention can significantly improve customer satisfaction and loyalty.
5. Custom Reports and Dashboards
Zonka Feedback allows businesses to create custom reports and dashboards that provide a comprehensive view of their NPS data, segmented by various criteria such as customer type, region, or product usage. These insights help you identify specific areas for improvement and develop targeted strategies.
You can generate reports based on customer type, region, or product usage to identify specific areas for improvement. You can then use these insights to develop targeted strategies that address the unique needs of different customer segments.
6. Closing the Feedback Loop
Zonka Feedback facilitates closing the feedback loop by providing tools for centralized collaboration and communication. You can quickly respond to detractors, take preventive actions, and convert them into passives or promoters. For promoters, the system helps gather reviews and testimonials, turning them into brand advocates.
For example, consider a financial services company that receives feedback from a detractor who is unhappy with the online banking experience. The feedback is escalated and the customer service team reaches out to understand the specific issues. After resolving the problems, they follow up with the customer to ensure satisfaction.
Simultaneously, promoters who leave high scores are prompted to share their positive experiences on review platforms, enhancing the company's reputation and attracting new customers.
Conclusion
A good NPS score varies significantly across industries, but knowing where your business stands in comparison to industry benchmarks can help you set realistic goals and focus on areas needing improvement. With the right tools and strategies in place, you can elevate your NPS, enhance customer satisfaction, and achieve sustained business success.
Zonka Feedback is one such NPS tool that can help you not only collect feedback with NPS surveys and benchmark your score, but also significantly enhance it. With its powerful features like AI-driven insights and text analysis, automated workflows, real-time alerts, custom reports and dashboards, you can timely and effectively convert detractors into loyal customers and promoters into brand advocates, thereby closing the feedback loop.
Sign up for a 14-day free trial and start your NPS journey today to set your business apart in a competitive market!


