Chapter 1
Introduction to Customer Effort Score
There are lots of ways to improve customer satisfaction and experience, one among them is by reducing customers’ efforts to interact with your business. Think about it - wouldn't you be happier to deal with a company where the processes are easy and you don't have to really make a lot of effort to get something done? That's exactly what CEB, now Gartner, also thought. They’ve emphasized the significance of reducing the customers’ efforts to improve the customer experience and introduced the Customer Effort Score metric to measure customer effort. If simplified, it translates to Low Customer Effort Score = Drives High Customer Loyalty.What is CES?
Customer Effort Score (CES) is a Customer Service Metric that measures the perceived levels of effort your customers have to put into a certain interaction with you to get their work done or achieve their goals. The core idea to develop the CES is to clearly track how much effort was required on the customer’s side to solve an issue and reduce it to boost the loyalty rate.
How was CES Developed?
Poor customer experience increases disloyal customers. As a result, they either leave the website or provide negative reviews. According to Gartner, it seems that around 96% of consumers that reported having difficulty solving a problem were more disloyal. Customer Effort Score gained immense popularity in 2010 when the Harvard Business Review published an article entitled "Stop Trying to Delight Your Customers."
In this article, they’ve laid emphasis on the importance of calculating and evaluating the effort experience of the customers because evaluating and acting on the data collected from CES to help you remove obstacles for the customer and improve their customer experience.
According to the Book “The Effortless Experience,” 96% of customers with a high-effort service interaction become more disloyal compared to just 9% who have a low-effort experience. Disloyal customers are likely to cost the company more — they spread negative word of mouth and cease future purchases.”
Chapter 2
Importance of Measuring CES
The Customer Effort Score metric gauges the level of effort that customers have put to achieve their goals while interacting with your company and your team. It gives you a quantitative measurement of what customers perceive when doing business with you and how hard or easy they think it is. Let's explore how this helps your business and why it's important to measure CES.
- More Predictive of Customer Loyalty
If we talk about Customer Feedback Metrics or Customer Experience Metrics, we have broadly 3 metrics available that are popularly used, Customer Satisfaction Score (CSAT), Net Promoter Score (NPS), and Customer Effort Score (CES).
Initially, CSAT was the first metric to measure customer experience and considered as the most predictive power metric for customer loyalty. But in 2003, Fred Reichheld introduced the Net Promoter Score at Bain & Company to measure customer loyalty. In 2008, the Corporate Executive Board (CEB), now Gartner, brought the Customer Effort Score (CES) metric for measuring customers' effort experience. According to them, Customer Effort also affects Customer Loyalty. Now the question is if all three metrics work for driving customer loyalty and better experience then which one is the most persuasive option?
About this, various research was conducted by CEB. In one research, they've found that high-effort service experience makes your customer disloyal towards your brand and increases the churn rate.
In 2010, Gartner determined a correlation between the amount of effort required by a customer to resolve a problem and customer loyalty. Less the effort more likely the customer was to become loyal. Customer Effort Score gained immense popularity in 2010 when the Harvard Business Review published an article titled 'Stop Trying to Delight Your Customers' in which they emphasized that reducing efforts is much more important than delighting your customers. - Predicts future customer purchase behavior
CES helps you know whether your customers will purchase your products again from your business or not. You can use Customer Effort Score data to predict the future purchase behavior of your customers. According to the study by HBR, 94% of customers who reported low effort said they would likely purchase a product again. - Indicates likelihood of customer referral
If your customers give you low customer effort score, it means they are not happy with your customer support services. they may churn out of your business. But they will not stop here only. they massively spread negative word of mouth for your business. 81% of customers who reported massive effort said they would speak negatively about the company to others. So, if you provide easy interaction and effortless customer services, this may encourage your customers to refer your products, services, or business to other consumers. - Returns on Investment in CES
Here are some noticeable statistics that can help you to realize very well that why you need Customer Effort Score for your business:
-
- More Effective than NPS and CSAT: The CEB found that CES is 1.8x more predictive of customer loyalty than CSAT and 2x more predictive than NPS.
- Ensure Effortless Experience: 88% of the customers going through an effortless experience are likely to spend more.
- Improves Repurchase Rate: 94% of customers who experienced low-effort service interaction are intended to repurchase.
- Reduce Cost: CES has phenomenally declined 40% of repeat calls, 50% of escalations, and 54% of channel switching. This has lowered the effort experiences and reduced costs by 37%.
Chapter 3
Advantages & Disadvantages of CES
Even though Customer Effort Score (CES) is a great metric that predicts the customer loyalty and helps in improving the business growth, but no score is perfect! There are some good things and some anomalies. Here’s some advantages and disadvantages of the Customer Effort Score.
Advantages of CES
-
It strongly predicts the behavior and satisfaction level of the customers.
-
It is highly actionable and makes it easy to take corrective actions quickly.
-
It enables you to find out weaknesses at each customer touchpoint.
Disadvantages of CES
- Does not provide a clear picture of the overall customer relationship with the business.
- It doesn’t immediately tell you the customer problems in detail.
- There's a lack of segmentation of results based on the type of customer.
Chapter 4
CES Question and Calculation
CES Question
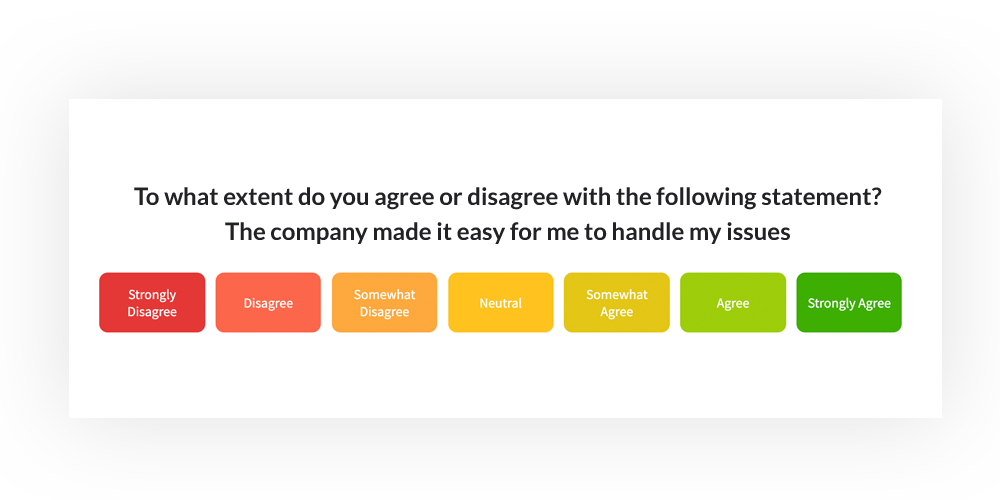
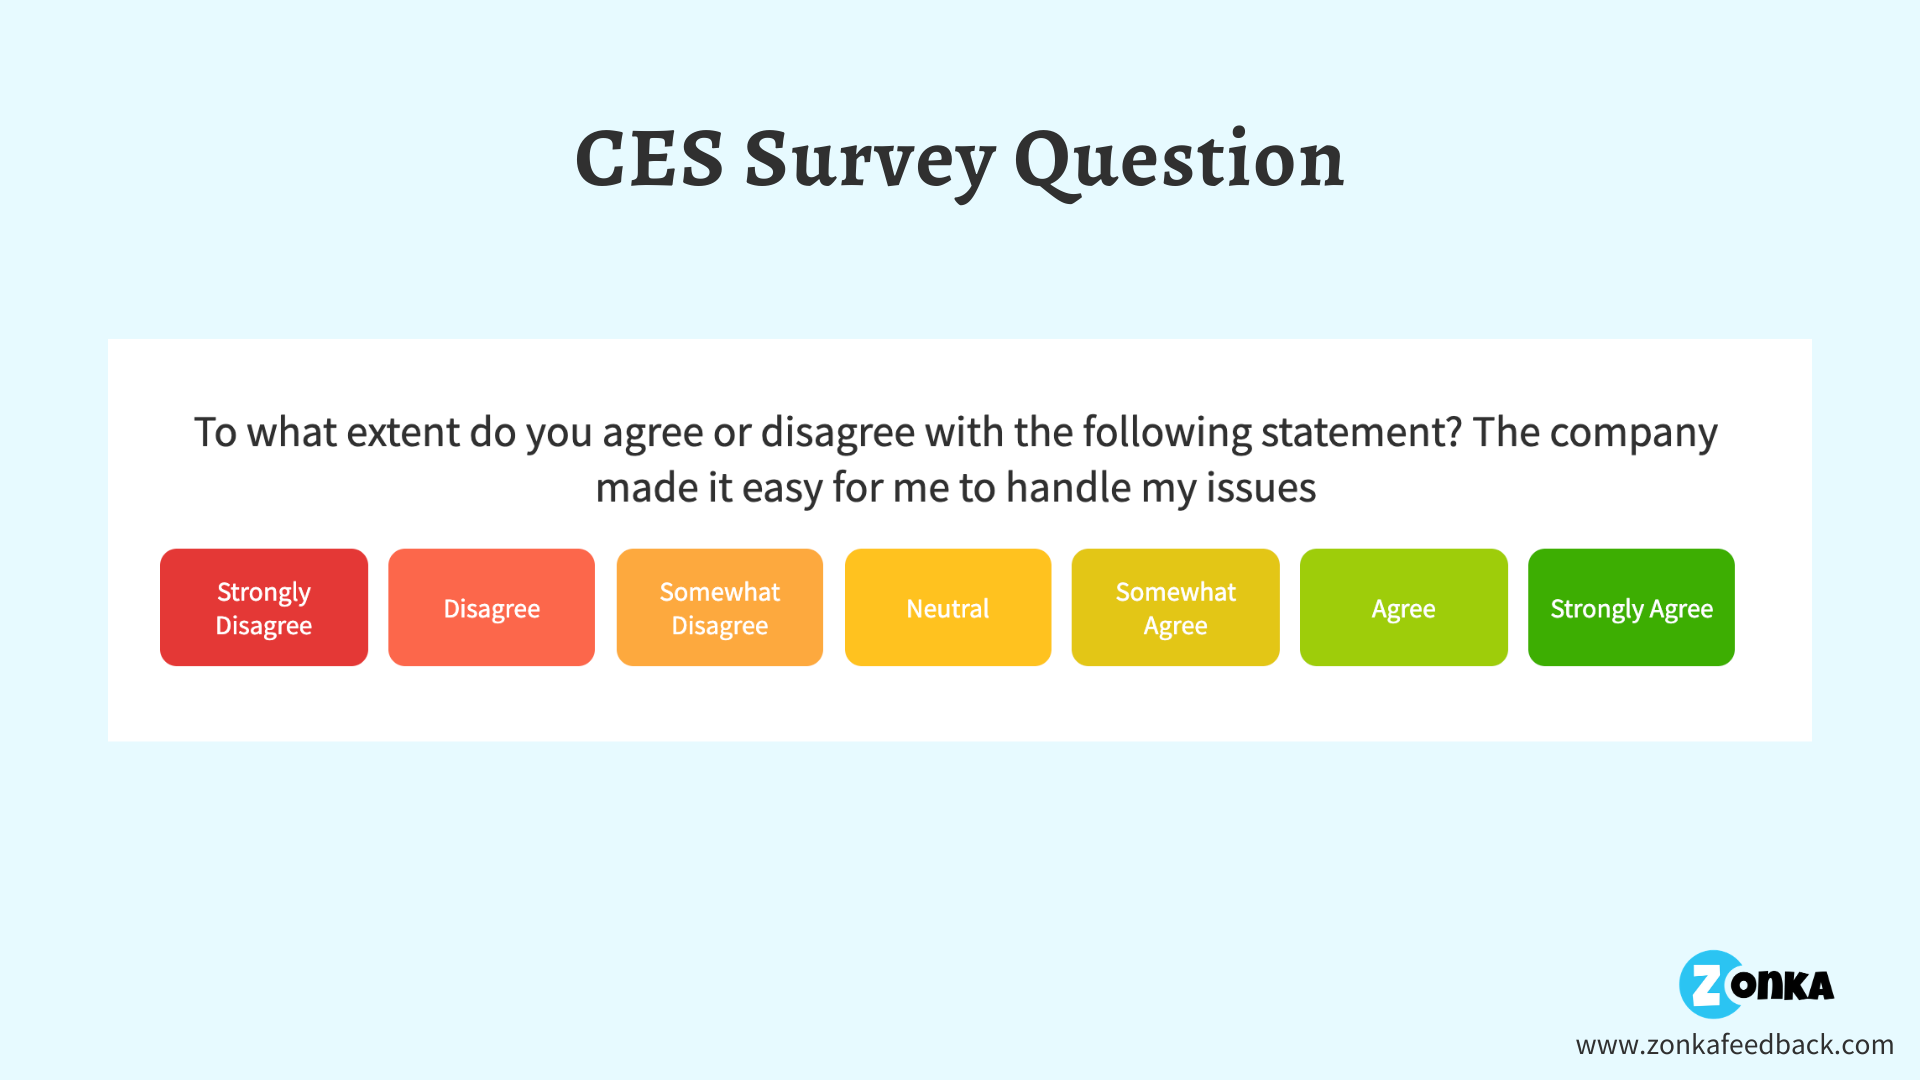
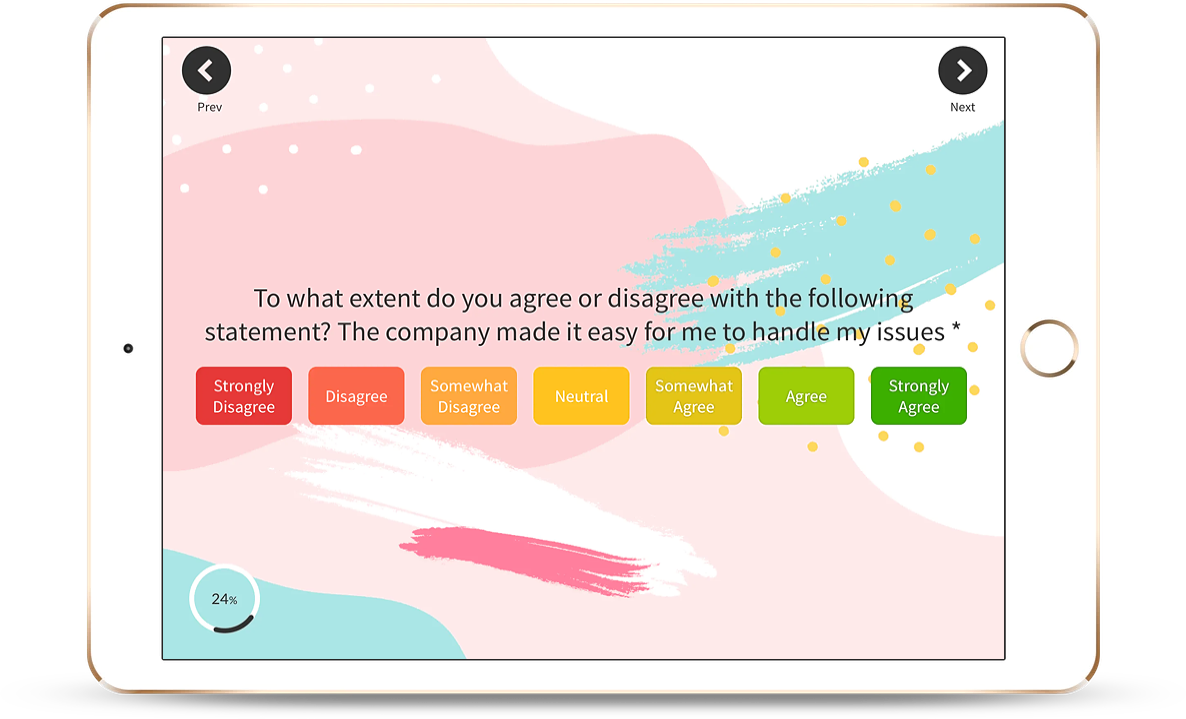
Customer Effort Score data can be collected by asking the simple CES question — To what extent do you agree with the following statement: The company made it easy for me to handle my issue. Customers usually answer on a standard scale ranging from 1– 7 scale whether they agree or disagree with the statement.
1 = Strongly Disagree
2 = Disagree
3 = Somewhat Disagree
4 = Neither Agree nor Disagree
5 = Somewhat Agree
6 = Agree
7 = Strongly Agree
This is also known as CES 2.0. Here in this scale range, a 1-3 segment (Strongly Disagree to Somewhat Disagree) will be associated with negative results, whereas the 5-7 segment (Somewhat Agree to Strongly Agree) represents positive results.
How to calculate CES?
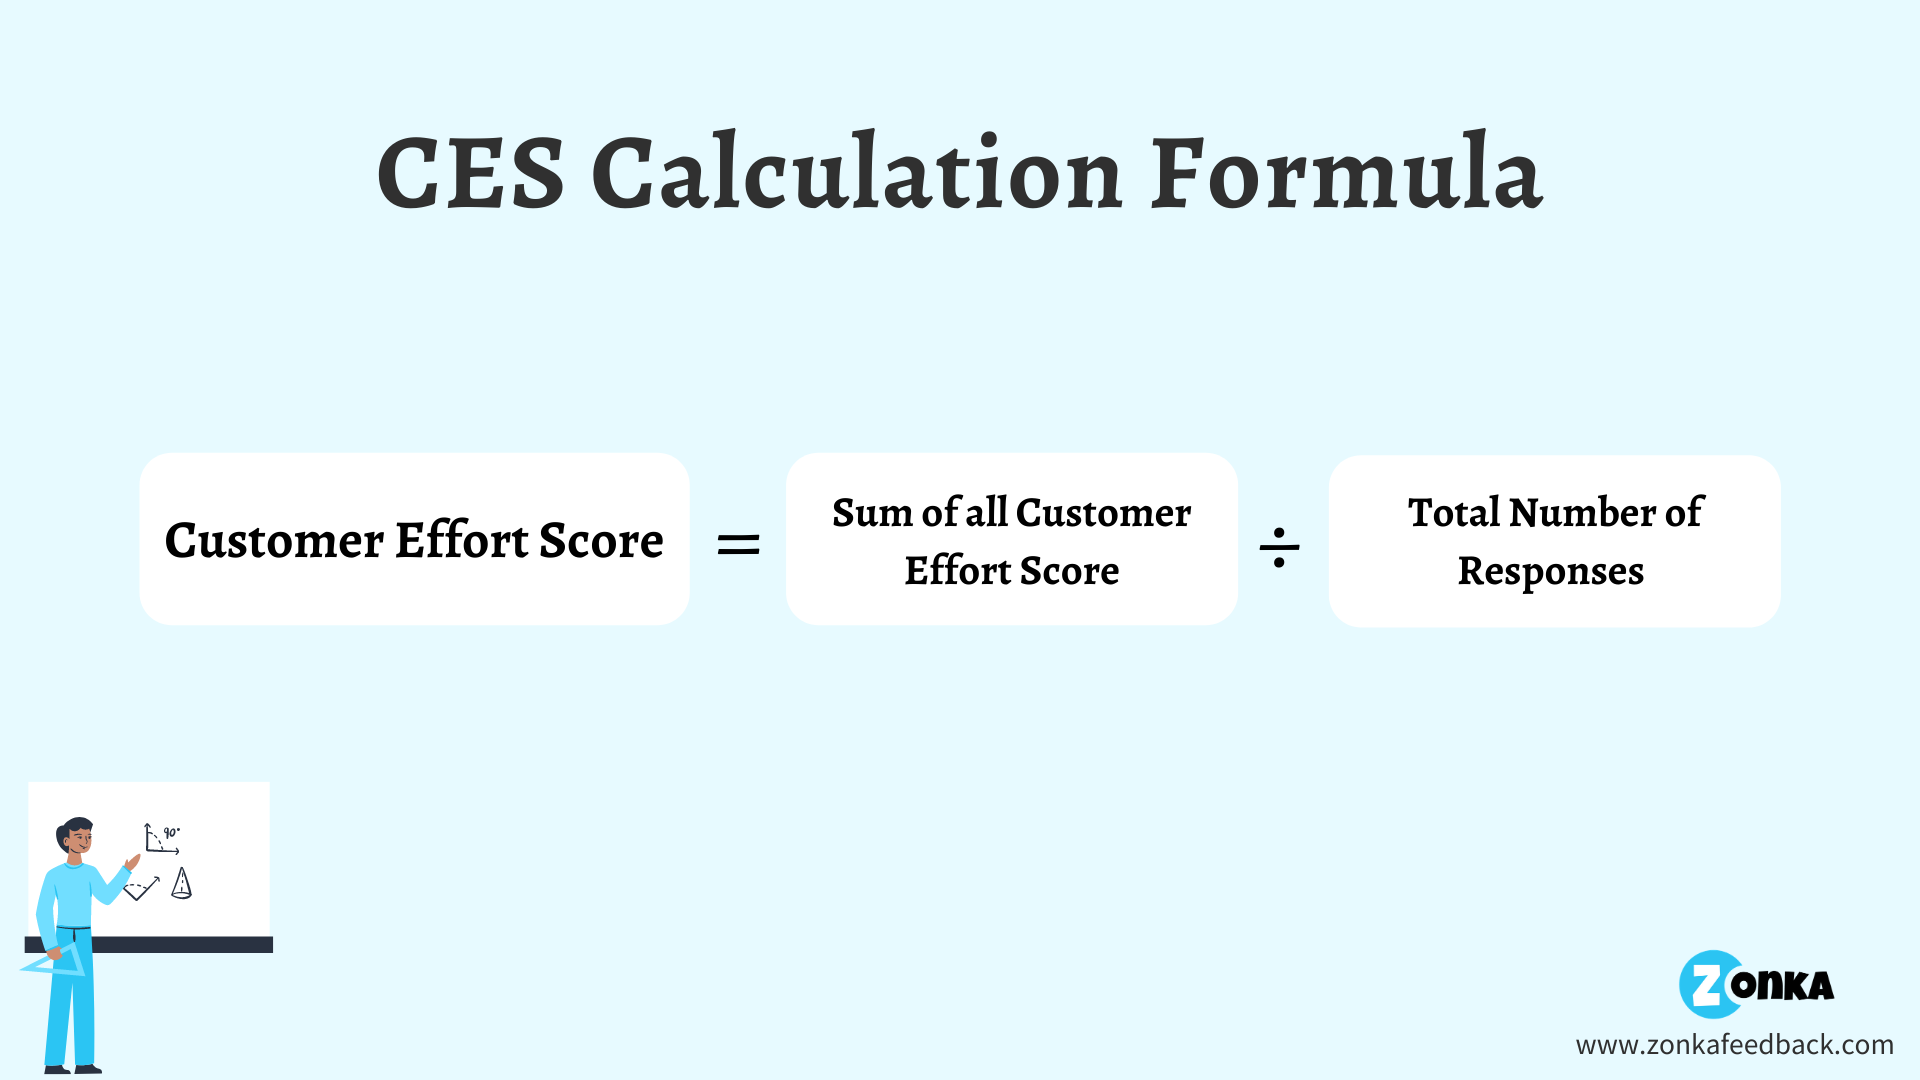
If you're using a Feedback Software to run CES Surveys, then that CES Calculation will be done automatically for you. If you'd like to calculate it manually, you can use the simple formula below.
 For example, say, if you get 12 responses: 3, 7, 5, 3, 7, 7, 6, 5, 7,7, 7, 7.
So, your Customer Effort Score = Addition of all Scores ÷ Total number of Respondents
CES = (3+7+5+3+7+7+6+5+7+7+7+7) ÷ (12) = (71) ÷ (12)
Therefore, your Customer Effort Score = 5.9
Chapter 5
What is a good Customer Effort Score?
Deciding a good Customer Effort Score (CES) is quite tricky, as there are no extensive industry standards or benchmarks to compare the quality of the score, as there are for NPS. The quality of your CES score depends on the type of CES question you are posing and which CES scale you are using. Ideally, the CES 2.0 is the question you should use for measuring effort.
Positive Customer Effort Score
A positive Customer Effort Score means your customers can use your products or services easily without any efforts. It also indicates that your customer support service agents are solving the customers’ queries efficiently. A good CES score can be employed effectively by marketing and sales teams as a testimonial or a differentiator to attract qualitative leads.
Negative Customer Effort Score
A Negative Customer Effort Score means your customers are putting more effort to get their queries solved. This will either make your customers irritate or they simply churn out of your business. To prevent this churn, you should follow up with them, improve their customer experience and close the feedback loop. This helps you to retain your customers in your business.
Customer Effort Score Benchmark
Every successful business is continuously benchmarking their competition to take its business a level ahead of its competitors. According to CEB Global, the overall benchmarks of CES 2.0 is below:
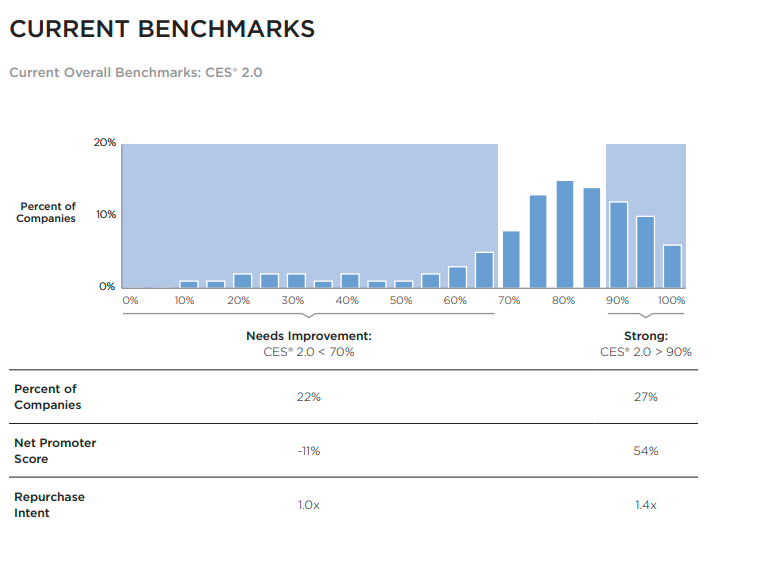
On the whole, there are two things you should remember while measuring and benchmarking CES.
- Are you making improvements? Is your Customer Effort reducing over time? If yes, then you're definitely moving in the right direction. If it is stagnant or if the Customers are indicating more effort over time, then you need to relook business and customer service policies.
- Are your scores more positive than negative? A big area of concern that would need immediate attention is if you have more negative scores than positive. That means, more visitors and customers are finding it harder to deal with your business. If this is a regular trend in your business and your reports, then you should immediately address the reasons and gradually build more positive experiences.
Once you have aced the two points mentioned above, you can start looking at industry benchmarks to see how you fare against companies in your domain and region for customer experiences.
Chapter 6
What is a CES Survey, when and how to use it?
What is a CES Survey?
CES Survey is a feedback form in which respondents are asked to give feedback on how easy was it to interact with the company. The idea behind conducting the CES Survey is to track which product or service is easier to use and customers are more loyal to it. A high effort service interaction can mislead your customers and make them lose interest in your brand.
When to use CES?
Customer Effort Score (CES) metric provides meaningful insights into customers' efforts at any stage of the customer journey. There are various customer touchpoints where you can use the Customer Effort Score metric to improve their experience. Explore 3 crucial use cases of Customer Effort Score metric:
- Post Transaction or Interaction (Ideal for Retail, eCommerce, Healthcare, Online Bookings)
This is the most common use case for CES surveys when customers purchase your product or subscribe to your service. This helps you understand and measure how the purchase experience was for your customer - was the purchase experience delightful, did the customer face any issues during the transaction, are there any improvements you can do for a quicker and easier transaction? The CES Surveys post transaction and interaction can be after booking an appointment, after an online purchase, after a subscription, after a free trial sign up, after a demo and more. With these post transaction CES Surveys, you can quantify customer experience and improve your interactions and transaction processes. - Service Interaction (Ideal for Help Desk Tickets, Call Center)
Another very popular use case for CES Surveys is after a service interaction. Post a complaint ticket has been raised by your customer and resolved by your team members and agents, you can send a CES Survey to ask customer for their feedback about the ease of getting their issue resolved. This CES Survey could have both the close-ended CES 2.0 question as well as a follow up open-ended question to know customer feedback in their own words. By taking a CES feedback after service interaction, after a ticket has been closed, or a service has been executed, you can get an instant feedback about the experience your company is creating for the customer and how easy your staff is making your customers' experiences. - To measure overall effort and experience (Overall)
Besides measuring the discrete level of user experience, the Customer Effort Score metric enables you to gauge the overall customer loyalty for the brand. CES can be used among both customer success teams and product teams to improve the effort experience of the customers. CES Survey helps you to identify and resolve the real bottlenecks in the customer experience itself.
How to use CES?
- Trigger CES Surveys with Emails and SMSes
Have a list of customers you'd like to survey? Send them CES Surveys via Email and SMSes so they can give feedback while on-the-go. You can easily upload a list of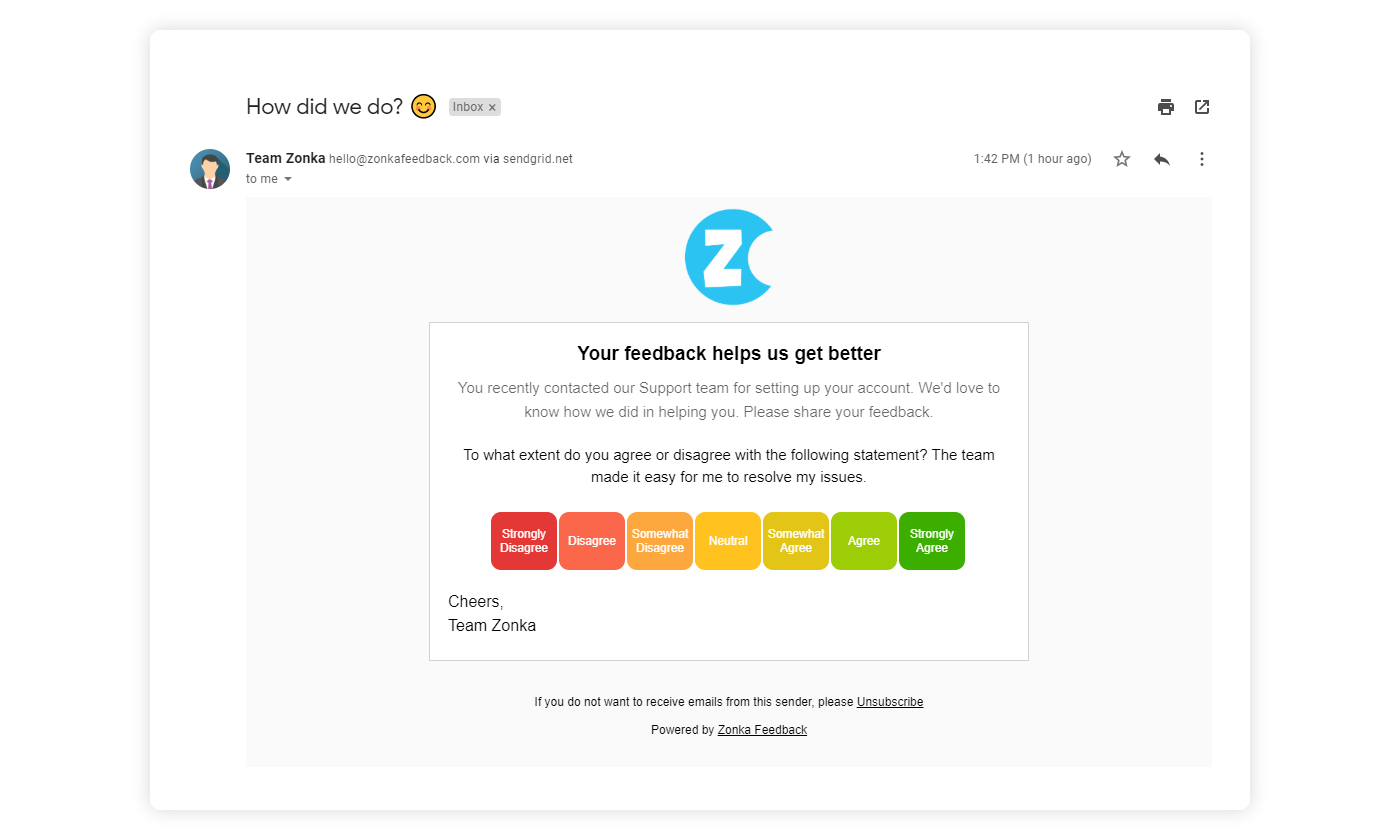
- Integrate with your Help Desk
You can also integrate the Zonka Feedback Software with your help desk. This helps you to generate and schedule the customized CES survey as per the situations and different customer touchpoints. The main benefit of integrating your help desk with the feedback system is that you can quickly identify the areas of issues and assign it to the respective teams to look after it and resolve the issues efficiently. - Integrate with your CRM
Zonka Feedback’s APIs integration system enables you to connect the platform to other tools and apps. Additionally, you can use out-of-the-box integrations for various purpose such as:- Send collected responses to other tools and apps
- Automate sending of email and SMS surveys from other apps
- Pull responses and reports to other apps
- Use Ready-to-use Integrations with apps like Mailchimp
- Connect to SMS Gateway
- Connect to Apps through Zapier
- Using Feedback Kiosks on Premises
Using the Kiosk Feedback system is beneficial when you want to capture instant real-time data at events like trade shows, exhibitions Based on the data captured from the registration form, you can easily schedule a CES SMS & Email Survey. You can also import the collected data into various extensive CRM tools like Webhooks, Zapier, MailChimp, etc.
Chapter 7
CES vs NPS
CES vs NPS: Is CES a better customer satisfaction metric or NPS?
This question is always an arguable topic since the inceptions of customer satisfaction metrics. Lots of entrepreneurs have posted search queries on Google that Besides CSAT, should I use NPS or CES to improve Customer Satisfaction? To understand which one is better, you first need to know what these metrics are used for.
Let me first tell you that Net Promoter Score (NPS) and Customer Effort Score (CES) are correspondent survey metrics that have their significance if effectively used. Both metrics enable you to gauge the satisfaction and loyalty level of the customers.
The only difference is its deployment as per the situations. In some situations, NPS works more effectively than CES and in some situations, CES is proven to be a better customer satisfaction KPI. The questions of both the metrics target to improve the satisfaction level, NPS does through customer loyalty and CES through customer effort level.
Conclusion
The Customer Effort Score (CES 2.0) evaluates customer behavior for their latest interaction with the business through customer support representatives. It asks the customers to rate how the company made it easy for you to handle your issue. Whereas, Net Promoter Score (NPS) depicts the customers’ loyalty and the level of brand shareability by tracking the customers’ likelihood of recommendations of your products, services, or brand to a friend or colleague”.
Chapter 8
How to Improve Customer Effort Score at Your Company
High customer effort scores can easily take your customers away from your business and bring down your business growth. When it comes to improving or reducing the customer effort score, various factors like accurate resources, strategies, tools, and manpower are playing a crucial role. Explore 5 easy ways to lower your customer effort score and deliver effortless experiences:
- Make yourself easily accessible at every touchpoint of the customer journey
Today's customers are tech-savvy, and besides quality products and services, they expect brands to treat them with seamless experiences. They don't want to make many efforts or move from one channel of communication to another to achieve their goals. So, keeping this in mind, businesses have to make themselves easily accessible to their customers at every possible touchpoint.
You should provide an easy-to-access feedback channel where customers can speak about the company's products and services and share their grievances for any inconvenience. So, to make sure that you are easily accessible to your customers, you should start gauging and monitoring the entire customer at various touchpoints. Make yourself connected to customers easily by deploying multi-channel feedback options including Email Survey, SMS Survey, Kiosk, QR Codes, Tablet Feedback system, and many more.
For example, Amazon actively engaged with its customers and communicated with them at various touchpoints including post-order confirmation, post-payment, and post-delivery. They make themselves available at every channel including chat, call, and email. - Improve the Level of Self-Services You are Offering
When it comes to providing self-service experience to the customers, businesses use various resources including a full-fledged knowledge base. But setting up a good knowledge base is not enough. You need to update and enhance your knowledge base regularly. Besides all these, you need to take care of the placement of your knowledge base.
For example, say if you are a survey service provider and customers visit at your Net Promoter Score page. So, to reduce their efforts, you can either put the NPS knowledge base at the bottom of the page or you can also put some FAQs related to it. This helps your customers or visitors to understand your business and services without investing more effort. - Reduce Your Average Response Time
Response time is also another important factor that constitutes the overall experience of the customers. If you want to low down the customer effort score, then you need to focus on improving your approach to responding to your customers. The average response time is pegged at 7.3 hours and the standard resolution time is 24.8 hours.
When your customers raise any query, always respond to them quickly. Your customer support team should keep itself active over every communication channel like a chatbox, messenger, complaint site. This helps them to quickly address the issues of customers. When customers get their queries solved quickly without investing much effort, they will build a positive perception of the brand. - Close the Negative Feedback Loop
Getting negative reviews from customers is not the biggest concern, as long as they figure out the solutions to mitigate their impact. When you receive negative feedback from your customers, don’t panic. Strategize to mitigate the impact of negative feedback and focus on closing the feedback loop to reduce the customer churn rate and rebuild customer loyalty. - Evaluate Your Customer Service Performance
Customer Service is the linchpin that determines the success of the business. Today’s customers are tech-savvy and expect everything to be quick and seamless. Thus, slow response time and high effort experience can turn your customers away from your website. So, if you want to improve the customer experience, you need to speed up the communication process to reduce the interaction efforts.
Customer Effort Score metric will not only evaluate the customer's efforts to interact with you but also help you to find specific points where you can speed up communication.
Chapter 9
Difference between CES and CES 2.0
When it comes to measuring Customer Effort Score (CES), the CES metric offers an extensive range of scales that help you to collect data excitingly from your customers without boring them. If you’ve started to measure the effort experience of your customers with the Customer Effort Score, then first identify the difference between CES and CES 2.0. Now the question is:
Why CES to CES 2.0?
Two major anomalies force CEB to transformed from CES to CES 2.0:
- The CES question interpretation
- The CES Scale
The CES Question Interpretation
In the year 2010, the CES question “How much effort did you personally have to put forth to handle your request?” was used to measure the customers’ efforts. But CEB, now Gartner noted some flaws:
- Incorrect Interpretation - Participants/ Respondents didn’t always correctly interpret both the question and the answer.
- Effort - Word ‘effort’ does not translate well into other languages leading to confusion in some geo-locations.
Thus, the limitations in the CES original version have emphasized the significance of choosing the right choice of word in the question and led to the inception of CES 2.0.
The CES Scale
The CES Scale While measuring the effort level of the customers, conventionally, CES offers 3 major CES scales:
- The 1-5 Scale
- The Likert Scale
- The 1-7 Scale - CES 2.0
The 1-5 Scale
Before 2013, 5-Point Scale was widely used to calculate the customer effort score. Here in this scale, respondents are provided with the 5 options:
1 = Very low effort
2 = Low effort
3 = Neutral
4 = High effort
5 = Very high effort
In this case, you will get a CES between 1 and 5, the lower the score, the better will be the results. This inverted scale of ranging the effort experience has caused some trouble. As people perceive high scores with a positive experience, so, some respondents intuitively clicked 5 and hurt the CES of the brand.
The Likert Scale
In this scale, respondents are provided with the “Strongly Agree/Disagree”, “Neutral”, and “Agree/Disagree” scales to answer the Likert scale questions by choosing the option according to the level of effort they put in to get their queries resolved. It can also be represented with different color codes like red color represents strongly disagree and green color represents strongly agree. The most common issue noted with Likert scales is the Error of Central Tendency.
To solve all these common anomalies, CEB has incepted the 1-7 Scale, commonly known as CES 2.0 in the year 2013.
The CES 2.0
CES 2.0 introduced the 7 level answer scale to make it easier to analyze the level of customers’ efforts. You can measure CES by surveying customers with the simple question: “To what extent do you agree with the following statement: The company made it easy for me to handle my issue?” Customers usually answer on a standard scale ranges from 1– 7 scale whether they agree or disagree with the statement.


